What is covered in this article?
Overview
Year over Year, or yearly comparison charts, are a great way to see how you are performing when compared to prior years. Schools must understand how the numbers for this year compare to last year or the year before.
With our yearly Comparison charts you can also display 3 Year and 5 year Average data as long as the data exists in Enquiry Tracker.
Chart Features
Year over Year charts offer a variety of features including:
- Range Selector: Choose the Current Year, Current & Last Year, Current & Last 2 Years, Current & Last 5 Years or All Years, which will display the relevant data for the selected chart type.
- Filters: By changing the Starting Year, Intake Year Levels (Grade Levels), Stage or Status, the data will be updated to reflect only those students that match those values.
- Total Boxes: A total box displays the calendar year, the number os student enquiries received for that year based on the filter set and, for follow on years, the comparative increase or decrease in numbers/percentage.
Note: The Total Box for the Current Year displays the total number of enquires received to date and the comparison number/percentage (in green or red) is comparing to the same time in the prior box.
If you decide to hide a chart and compare the current year to two years prior, then the numbers will update accordingly.
- Average Charts: Depending on the amount of historic data you have, you can turn on the 3 Year and 5 year Average charts. These numbers are calculated based on the average number of enquiries received in the prior 3 or 5 year period, in this case month, to the current year. So if the current month is 10 and the 3 prior years you had 5, 6 and 7 respectively then the average is (5+6+7)/3 = 6
- Chart Types: The Enquiries yearly Comparison charts has 3 available chart types, which can be selected for the chart type selector menu.
- Column Chart
- Line Chart
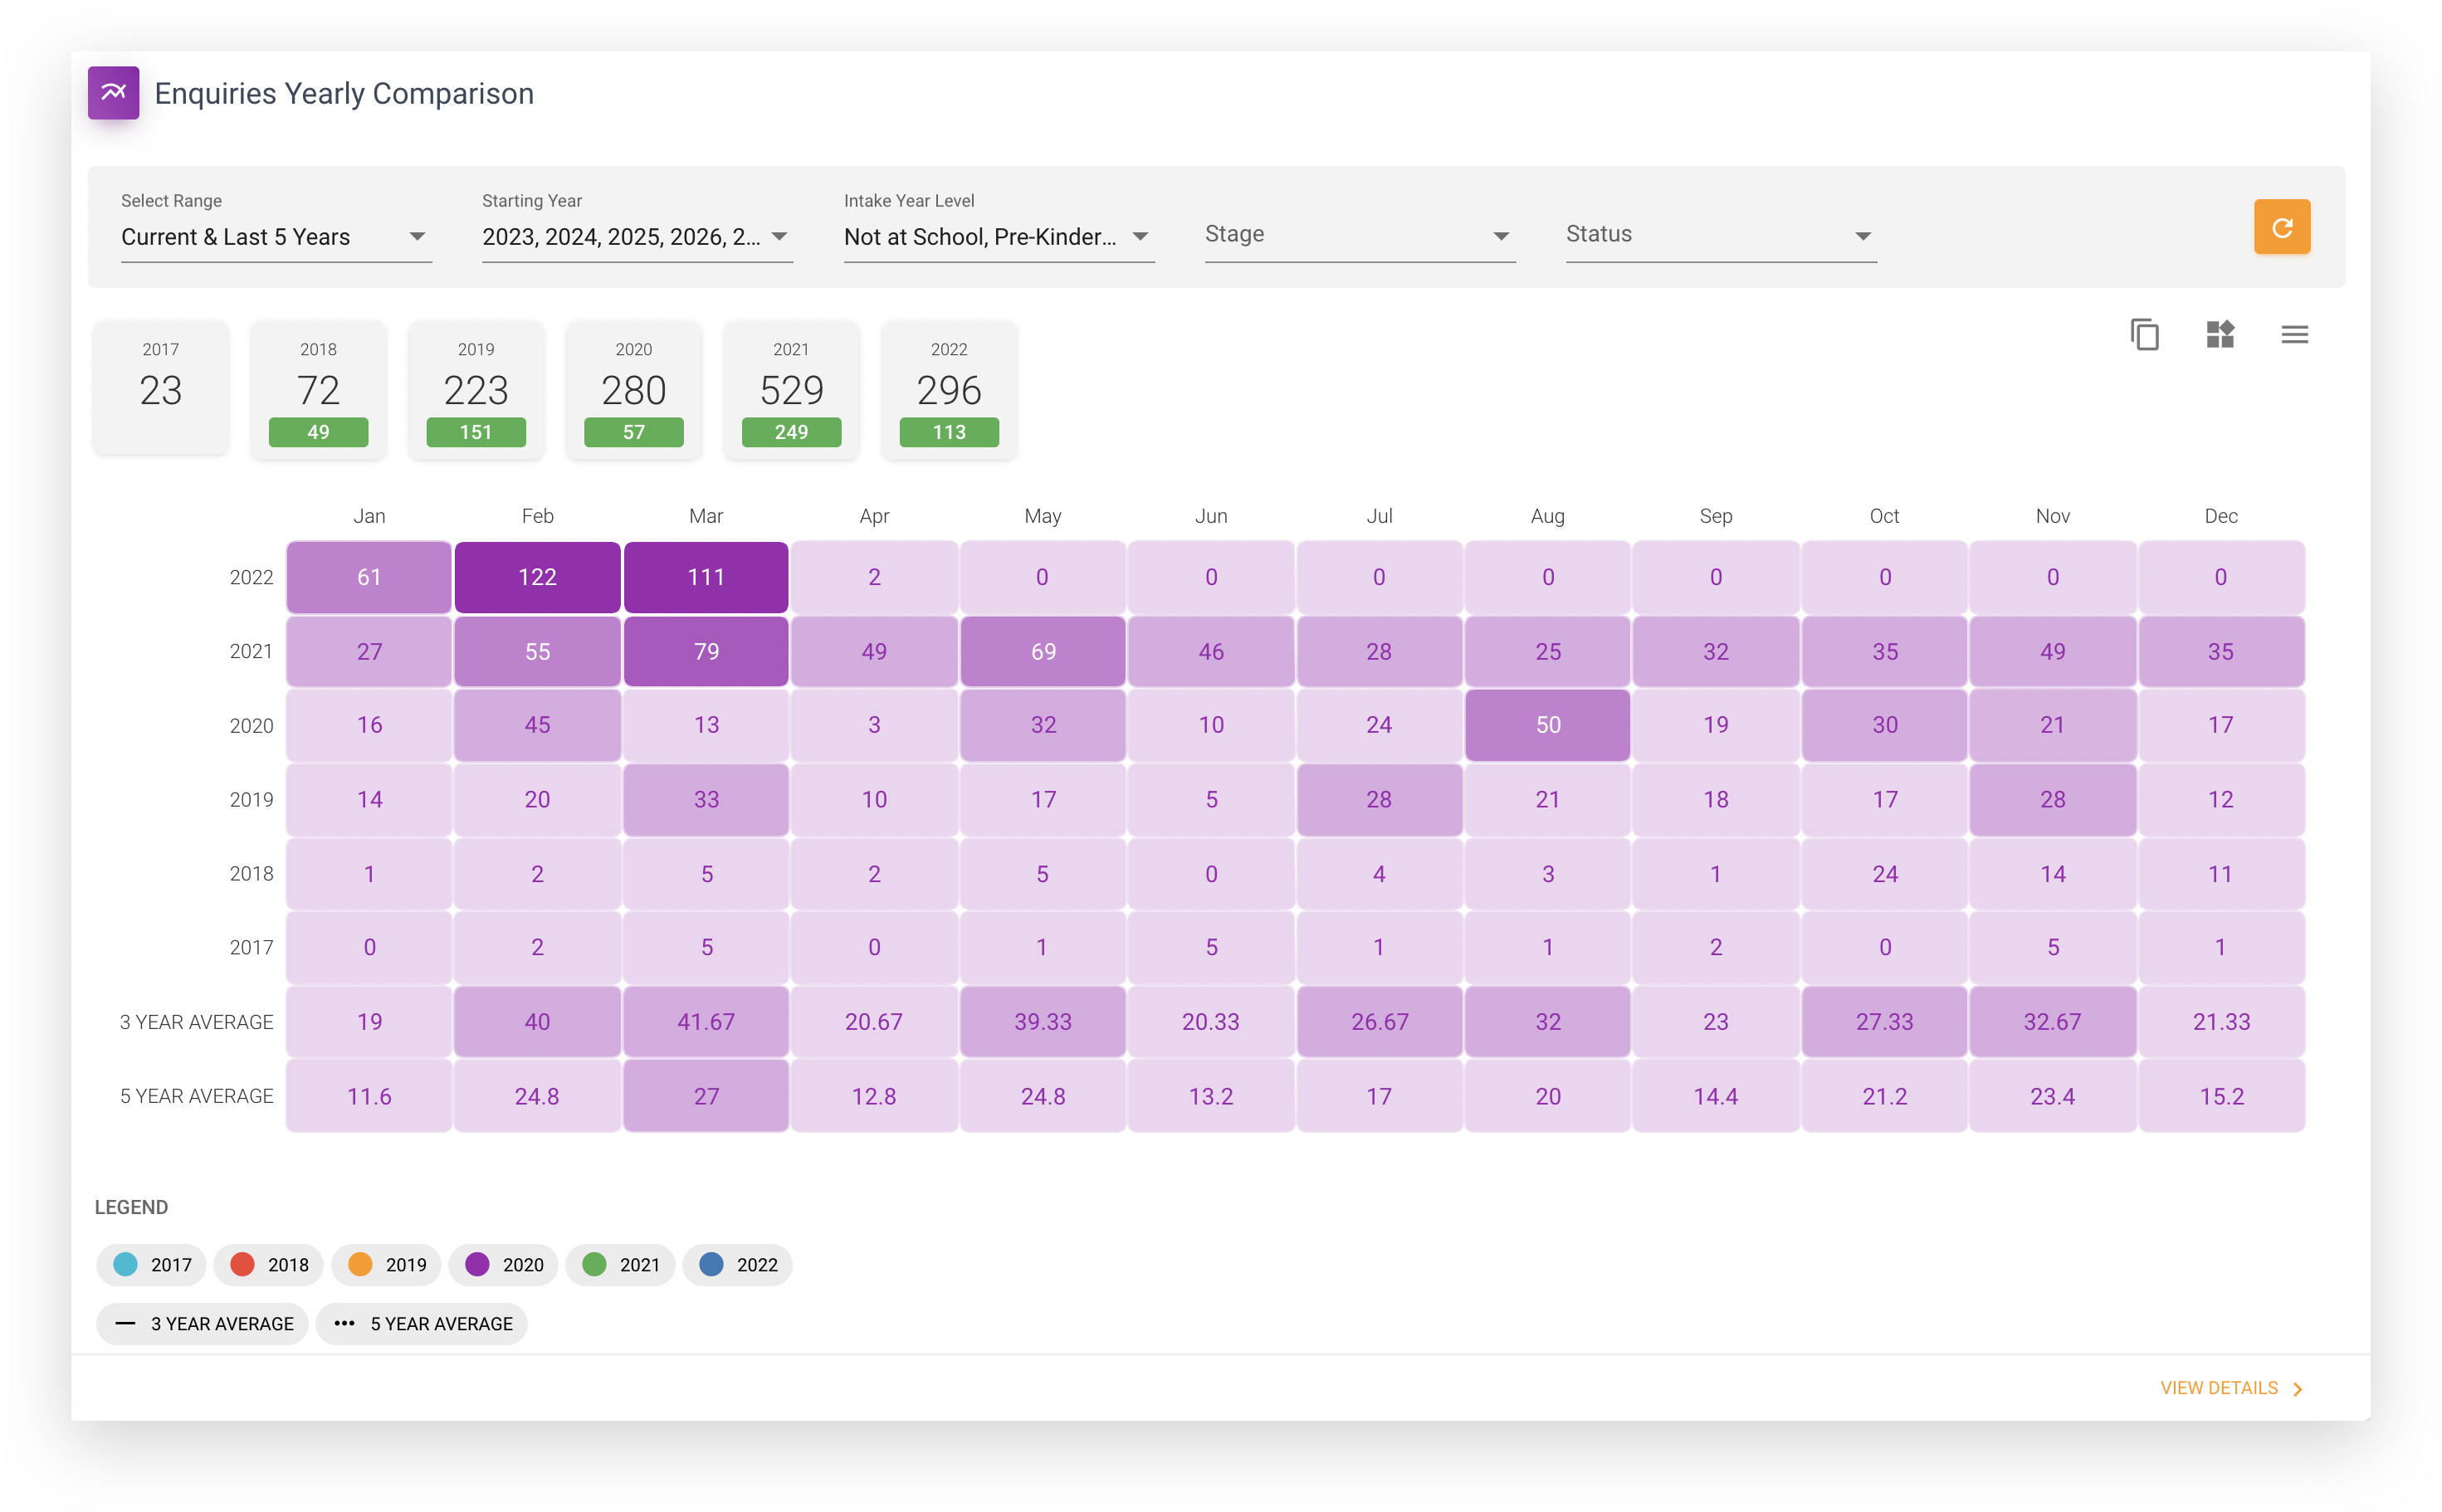
- Heat Map

| Tip: Clicking on any legend will toggle the relevant chart to be visible or hidden |
The heat Map chart displays numbers in colored cells where the darker the color the higher the number. In other words, the more darker cells you have the better off you are!